 Back to Parative

You don't need me to tell you how important retention forecasting is to your customer success strategy.
But, if you have made your way to this post, chances are that you are struggling with your retention forecasting.
Worry not!
With the right approach and tools, you can accurately predict and mitigate customer churn, drive customer loyalty, and improve business performance.
But how do you get started?
How do you confidently forecast customer retention and take customer success efforts to the next level?
This post will provide the ultimate six steps for improving retention forecasting.
We'll cover everything from utilizing predictive analytics and data science to artificial intelligence (AI) and machine learning models.
By implementing these steps, you can boost customer satisfaction, reduce churn rates, and create loyal customers that stick around for the long haul.
So if you're looking to unlock the power of predictive analytics and machine learning to drive your customer success efforts forward, let's jump right in!
When it comes to customer retention, the first step is to define the key metrics you’ll be tracking.
The most commonly used metrics are churn rate, Net Revenue Retention (NRR), and Net Promoter Score (NPS).
Churn rate is a measure of how many customers are leaving your service in a given period. It’s usually calculated as the number of customers that have left over a set period of time divided by the total number of customers at the beginning of that period.
This metric helps you understand how quickly customers are leaving and gives insights into what factors might be causing them to leave.
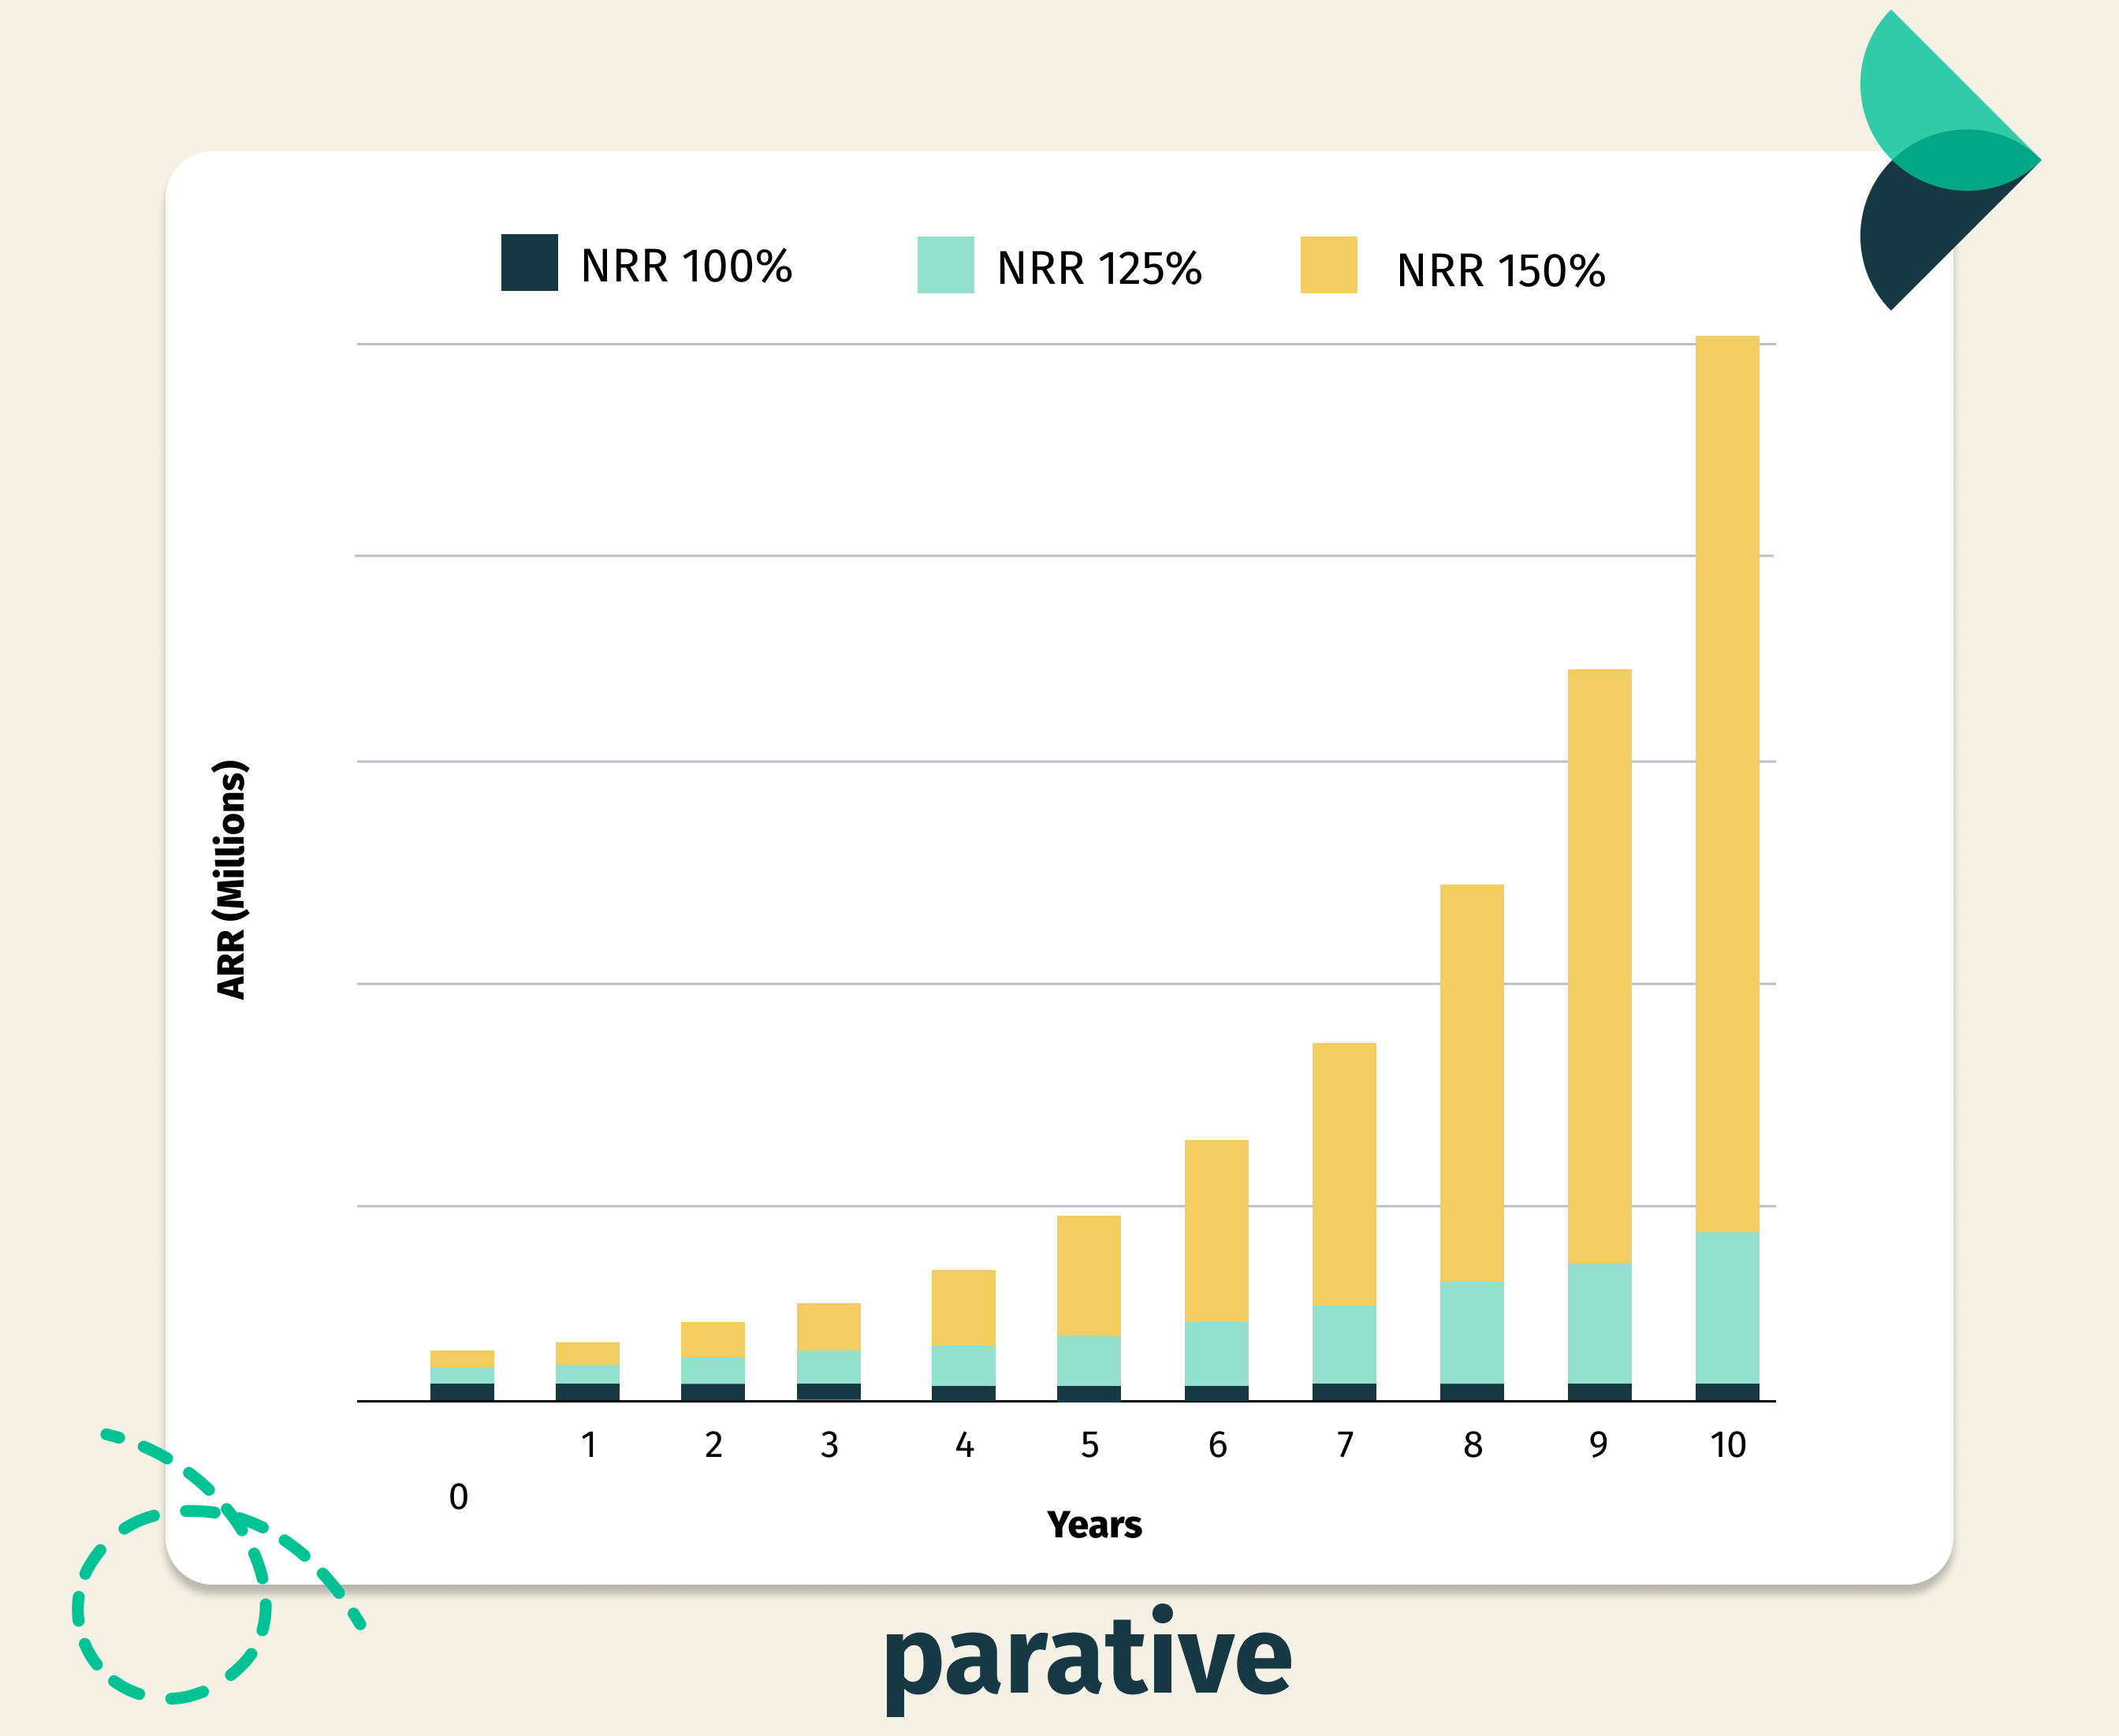
Net revenue retention measures how much revenue you retain from existing customers over time.
It’s usually calculated as the revenue from existing customers in a given period divided by the total amount of revenue from those same customers in the previous period.
NRR gives you an understanding of whether your current efforts are helping keep revenue from existing customers or if revenues are declining due to customer attrition.

The net promoter score is a measure of customer satisfaction and loyalty. It’s usually calculated by asking customers to rate their experience with your product or service on a scale from 0-10 and then grouping responses into three categories: promoters, passives, and detractors.
Promoters are highly satisfied customers who would recommend your product or service; passives are moderately satisfied but unlikely to recommend it; detractors are unhappy customers who would not.
By tracking NPS over time, you can measure customer satisfaction and loyalty and identify areas for improvement.
Once you have identified the key metrics to track, the next step is to improve upon those metrics by considering other factors, such as product behavior and customer-fit.
Scores in this category include Expansion Qualification Score, Churn Risk Score, Customer Health Score, and Expansion Account Fit Score.
The expansion qualification score is a metric that assesses whether or not a customer is likely to be an ideal target for upsells or expansions.
It looks at usage behavior, including average spend, product usage rate, total active users, and more.
It can help you identify customers likely to benefit from expanding their current subscriptions or purchasing additional products and services. By focusing on these customers first, you can boost both revenue retention and loyalty over time.
The churn risk score is a metric that helps measure how likely a customer will churn in a given period.
It looks at historical data such as past usage patterns, support tickets created, and other indicators of customer engagement over time to calculate the risk level of each customer.
By tracking this score over time and assessing changes in activity levels or usage rates, you can identify customers who might be at risk of leaving your service so that you can take action before they do.
A customer health score measures how healthy your relationship with each customer is based on metrics like lifetime value (LTV), average usage rate, total purchases made, etc.
This score gives you an overall picture of each customer's activity within your ecosystem and provides insights into which ones are most engaged with your service offerings.
By tracking health scores over time, you can better understand which customers are more engaged than others so that you know where to focus your attention when upselling or expansion opportunities.
This score indicates which customers are best suited for an upsell/expansion opportunity based on how their firmographic data matches your ideal customer.
By tracking this metric over time – along with churn risk scores – you can identify which customers are more open to an upsell opportunity while also minimizing the risk associated with any potential losses due to a failed attempt at expanding their subscription package.
Combining these three metrics will give you a comprehensive view of customer health and help you track progress toward your 95% annual customer retention goal.
Having an accurate picture of customer health will allow you to take proactive steps to prevent churn and ensure that your current efforts successfully retain existing customers while attracting new ones.
At this stage of the game, it’s time to get serious about collecting data that will help you create an accurate retention forecasting model.
To do this, you’ll need to ensure that your existing tools are correctly integrated and consider adding additional data sources.
Most SaaS companies have many analytics and customer experience tools – such as Mixpanel, CRM, Pendo, etc.
Leverage these tools to gather key customer usage metrics and build a comprehensive view of their behavior and usage patterns.
Ensuring these tools are properly implemented and integrated will be crucial for achieving an accurate retention forecast.
Don’t rely on those existing tools for collecting customer data – there are plenty of other ways to gain insights into your customer’s needs and motivations. For example, consider implementing customer surveys regularly to measure how satisfied customers are with your product or service.
Look into social listening platforms or third-party review sites to get feedback from customers (or potential customers).
Access to more detailed and accurate customer data is essential to generate meaningful predictions about future churn rates.
Ensure you’re collecting as much relevant customer data as possible so that your predictions have some substance.
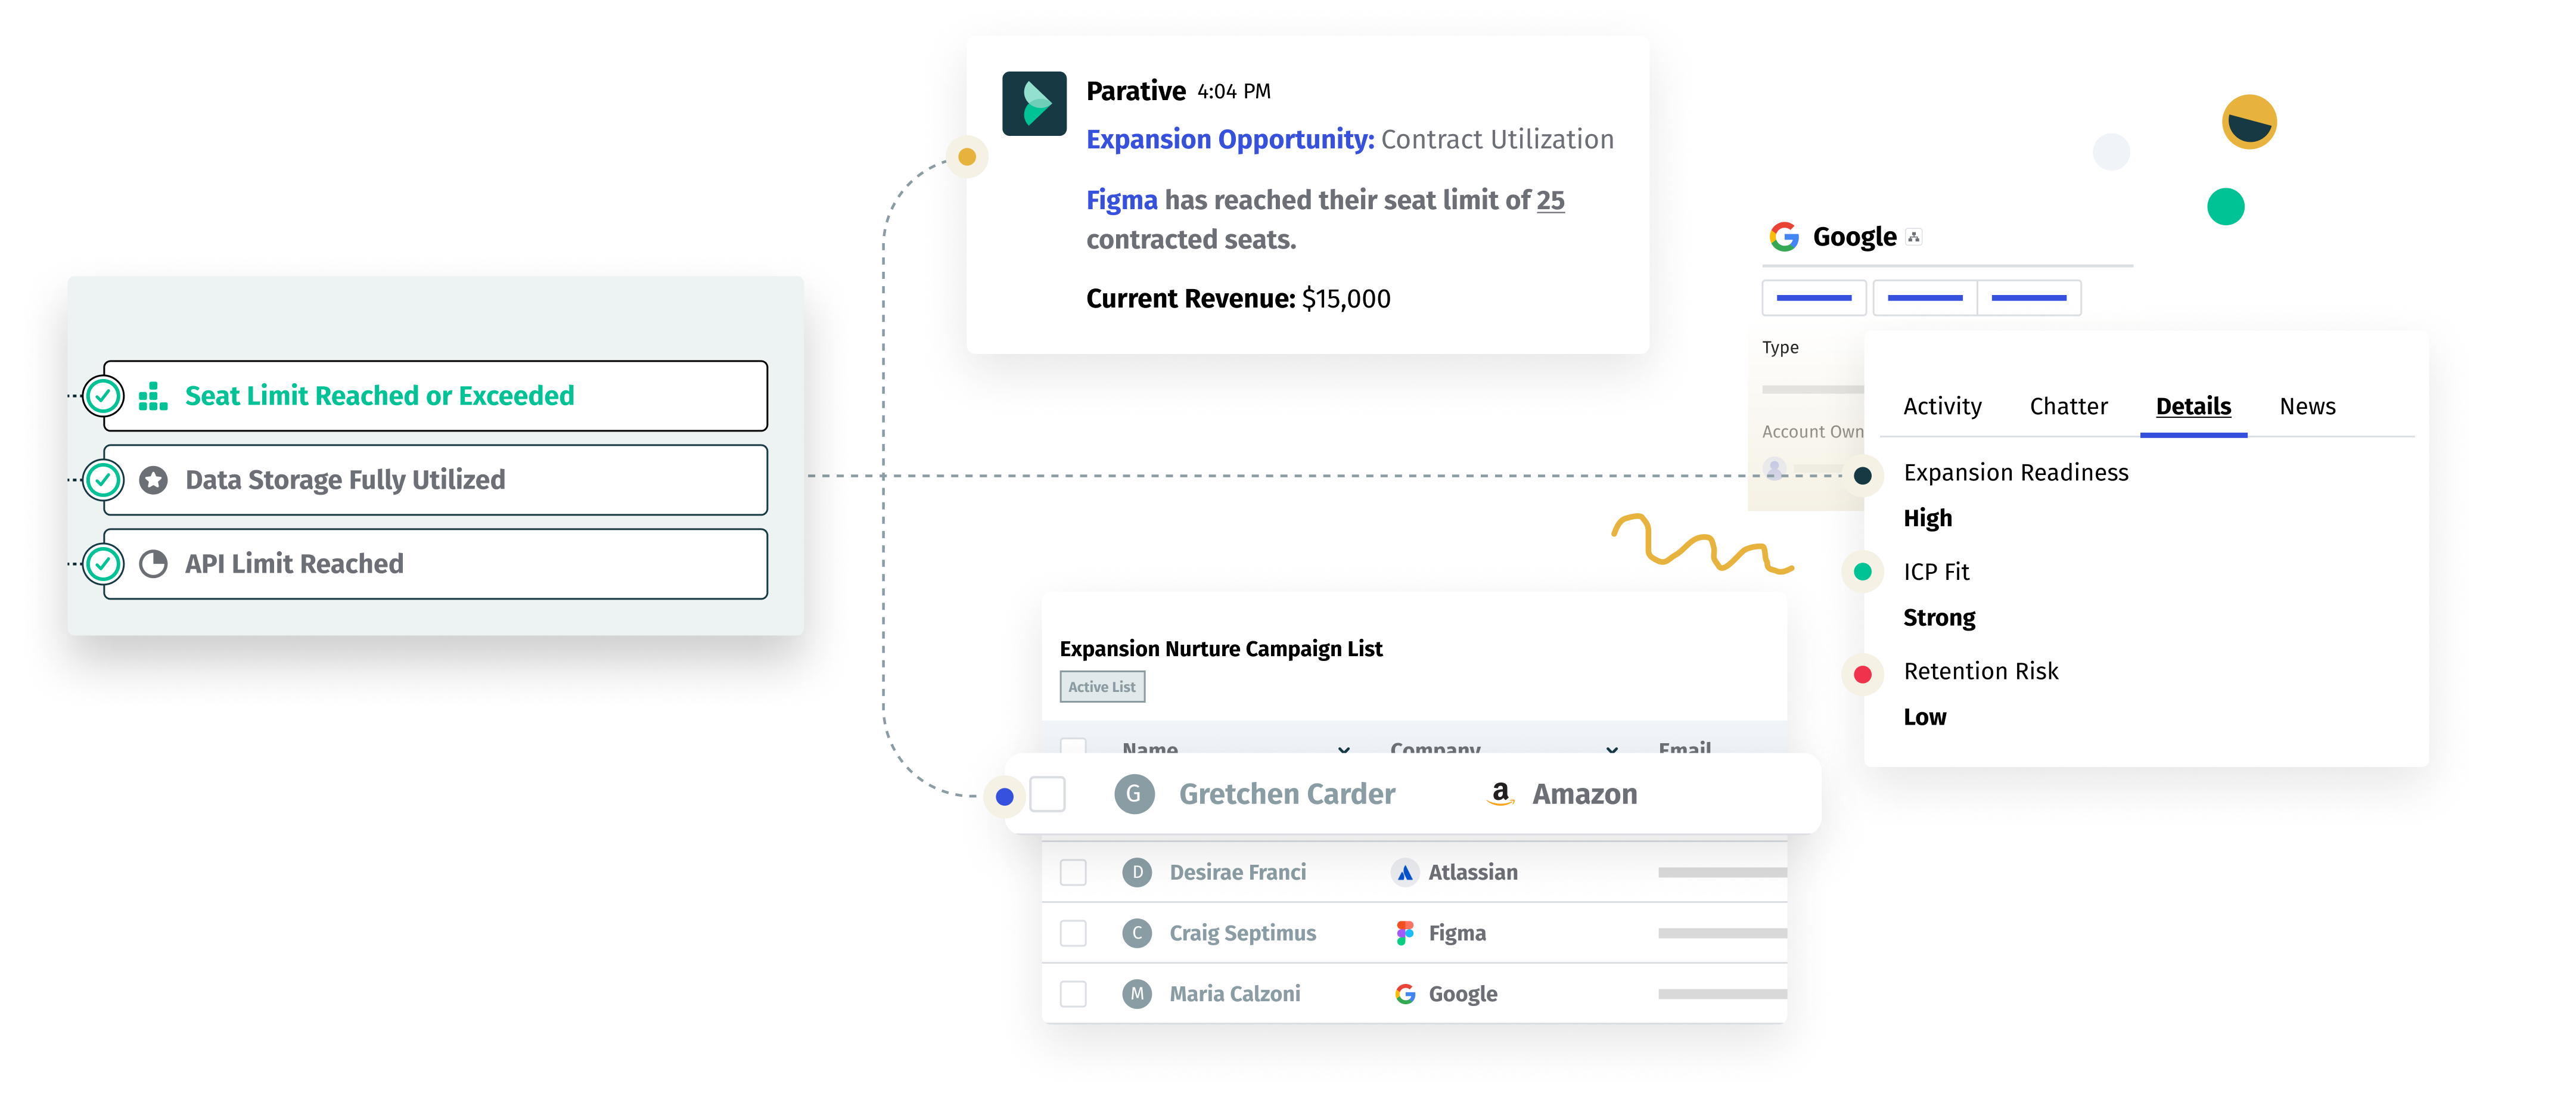
Parative is a Revenue Scoring Engine that helps businesses understand and predict customer likelihood to buy more or churn.
With the increasing number of data sources for various teams - from customer-facing teams like customer success and sales to RevOps, Product Management, and Data and Engineering - it can be difficult to make sense of all the data and identify key revenue signals.
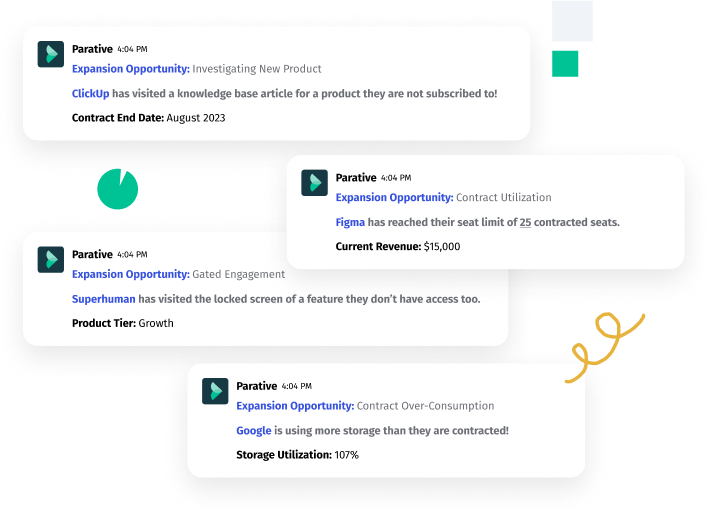
Parative solves this problem by monitoring customer behavior, usage, intent, contract consumption, feedback, and market conditions to score each customer's outcome readiness in real-time.
In addition, Parative:
Parative provides an invaluable toolkit for businesses of all sizes looking at enhancing their predictive analytics capabilities when it comes understanding customers better.


Customer data is valuable in predicting customer retention and informing customer success efforts.
The third step in crushing your retention forecasting is to develop a segmentation model that can be used to analyze usage patterns, contract size, and other relevant factors to identify potential risks for attrition.
Segmentation can provide valuable insight into customer behavior, allowing you to identify patterns that could inform your customer retention strategy.
By segmenting customers into different cohorts, it becomes easier to spot trends that indicate an increased churn risk and prioritize resources accordingly.
Additionally, segmentation provides the opportunity to understand better what types of customers are most likely to remain loyal—and which ones need more help from your team.
When building a segmentation model for retention analysis, there are several common segments you should consider:
Once you have identified the segments that best fit your particular customer base, you can apply the model to understand better how each segment behaves differently regarding loyalty and attrition rates.
You can use this information to create targeted strategies that address the needs of each segment separately—ensuring that each one receives the right level of attention and support from your team.
Additionally, this data can be used to keep track of performance over time so that you can continually adjust your strategies based on new insights gained from analyzing customer behavior within each segment.
By developing a segmentation model based on usage patterns, contract size, customer type, demographics, and other relevant factors, you will gain valuable insight into how best to approach customer retention efforts to maximize success rates across all segments in your target market.
Developing an effective model is one of the most critical steps when forecasting customer retention.
This model should be able to predict customer behavior and usage patterns to provide more accurate and actionable insights into customer health.
In this step of retention forecasting, we’ll break down how to develop a statistical model that will help you better understand your customers and their needs.
The first step in creating an effective retention model is understanding customer behavior.
It’s vital to identify key drivers of customer behavior, such as purchase history, product usage, and engagement levels.
Analyzing this data can provide valuable insights into why customers stick around or churn away from your company.
By understanding the factors influencing customer decisions, you can create targeted strategies for improving retention rates.
For example, suppose you find that customers who purchase more expensive products are more likely to stay with your business. In that case, you can focus on offering more expensive products to high-value customers to increase their loyalty.
Once you have identified the key drivers of customer behavior, it’s time to refine the retention model using segmentation models.
Segmentation models allow you to group customers based on similar characteristics and behaviors so that you can target them with tailored strategies for increasing loyalty and reducing churn rate.
For example, you may find that customers who use your product frequently are more likely to stay with your business than those who don’t use it as often.
By grouping these customers into a “frequent user” segment, you can target them with incentives such as discounts or free trials to encourage them to continue using your product.
Finally, once you have identified key drivers of customer behavior and created segmentation models for targeting different groups of customers, it’s time to use predictive analytics tools such as machine learning and logistic regression algorithms to develop an accurate predictive model for predicting customer churn risk.
By analyzing historical data about existing customers, these algorithms can be trained to accurately predict which new customers are likely to stay loyal and which ones are at risk of leaving.
With an effective predictive model, businesses can better understand their customer base and take proactive steps to improve retention rates by targeting at-risk segments with tailored strategies for increasing loyalty and reducing churn rates.
It’s not enough to build a retention model.
To truly make the most of predictive analytics, you must set up a real-time monitoring and alert system that notifies customer success teams of potential churn risks.
This system must be integrated with your retention model and other customer data sources to provide actionable insights into customer health.
Monitoring and alert systems are key for the timely identification of customers who may be at risk for churning.
These systems can also help you identify patterns in customer behavior that could lead to potential churn, such as a decrease in usage or an increase in support tickets.
By proactively addressing these issues, you can mitigate customer churn before it even happens.
Here are some key components you need to consider when setting up a monitoring and alert system:
Implementing a real-time monitoring and alert system is no small task, but it is critical if you want your retention forecasting efforts to succeed long-term.
By proactively identifying potential risks early on, teams can take quick action before those risks turn into actual churn scenarios — saving time and money in the process.
Plus, having access to detailed analytics makes it much easier for teams to assess their current retention strategies against others in their industry — giving them valuable insights into what works best for them so they can adjust accordingly.
To drive customer success and retention, fostering a culture of customer success within your organization is crucial.
This includes providing training and resources to the customer success team, encouraging cross-functional collaboration, and ensuring customer success is a priority for everyone.
Provide your customer success team with the necessary training and resources to help them develop the skills needed to drive customer success.
This includes everything from understanding customer needs and behaviors to using predictive analytics and machine learning models to monitor churn risk, identify opportunities for improvement, and develop personalized strategies.
It also means educating your team on using data-driven insights to build better customer relationships and create experiences that keep them returning.
Encourage collaboration across departments, so that customer success is a shared responsibility.
This means involving product teams in understanding customer feedback, marketing teams in creating personalized messaging, sales teams in developing tailored plans for upselling existing customers, and engineering teams in ensuring product reliability.
By working together towards the same goal - creating an outstanding experience for every single customer - you can ensure that everyone is focused on driving long-term loyalty.
Finally, ensure everyone - from the C-suite down - understands that customer success should be a top priority.
Encouraging the entire organization to adopt a customer-centric approach will ensure that all decisions are made to maximize customer value.
By taking these steps, you can foster a culture of customer success within your organization that will help you crush your retention forecasting goals.
With effective training and resources in place, cross-functional collaboration encouraged, and everyone prioritizing customer success as a key priority, you’ll be well-positioned to achieve long-term loyalty from existing customers while continuing to acquire new ones.
Creating an effective retention forecasting strategy is essential to understanding and mitigating customer churn, driving customer loyalty, and improving overall business performance.
To accomplish this, you need to take a data-driven approach that involves collecting and analyzing customer data, cross-functional collaboration, and a customer-centric approach.
Following the six steps outlined in this blog post can create a strong foundation for your retention forecasting strategy.
You can use predictive analytics, machine learning models, logistic regression analysis, and more to identify trends in customer behavior and predict churn risk.
Additionally, you can use customer feedback metrics like net promoter score (NPS) to measure customer satisfaction and loyalty.
Finally, continuously monitoring and evaluating your efforts with product analytics tools ensures that your retention efforts are successful.
Remember: every company has different needs when optimizing its retention forecasting strategy.
But by considering these six steps when crafting your own strategy, you'll be well on your way.


